On air

Broadcast software built by people who understand radio.

Built in real radio stations. Ceranimus started with one simple goal: eliminate hours of repetitive work from weekly music charts. Today it helps radio stations publish charts, collect votes and build archives in minutes.

Real hosts Real broadcasts Ready in minutes
radio4u.fm / chart
Radio 4U Hit Chart
Host — Maciek
17Votes
ChartArchive
1
▲ 7
Cheap Thrills
Sia, Sean Paul
♥ Vote
2
King
Years & Years
♥ Vote
3
▲ 2
Show Me Colors
Masterboy
♥ Vote
4
NEW
Flying High
Captain Hollywood
♥ Vote

Interactive preview — tap ☀ / ☾. Real screenshots below ↓

The problem

Every chart has a story.
It shouldn't take hours of manual work.

Running a weekly countdown is usually the same tedious ritual, week after week:

⏱️

Preparing the countdown

Counting votes, ordering positions, checking last week's ranks — before anything even reaches the listener.

📋

Moving data by hand

Retyping titles, artists and positions across a spreadsheet, notes and the website. Easy to slip up.

🌐

Updating the site

At the end you often still have to prepare the publication on the site by hand — covers, links, last week's archive.

Chart was built to simplify exactly this — from the listener's first vote to a finished countdown.

The result

Preparing the chart used to take me several hours. Now, after the show, it takes about 10–15 minutes.

Maciek — radio host, years on air
10–15
minutes after the show
before: several hours of work
What you get

Everything a countdown needs — in plain terms.

Not a list of 47 technical features. Four things that actually do the job.

🎵

Public chart for listeners

  • Live countdown with position movement — optional, not required (in settings)
  • Song voting
  • In-page playback
  • Archive of past editions
🎙️

Host zone

  • Prepare the show step by step
  • Live results at a glance
  • Waiting room & promoting new entries
  • Full chart history
🎨

Your station's look

  • Your own colors and logo
  • Day / night mode in one click
  • Branding for your station
  • On-air info in the header
⚙️

Admin panel

  • Users and roles
  • Settings and section toggles
  • Full control over the countdown
  • An installer that guides you
Product preview

This is what it actually looks like.

Real screenshots from the live system — not a mockup, not a render.

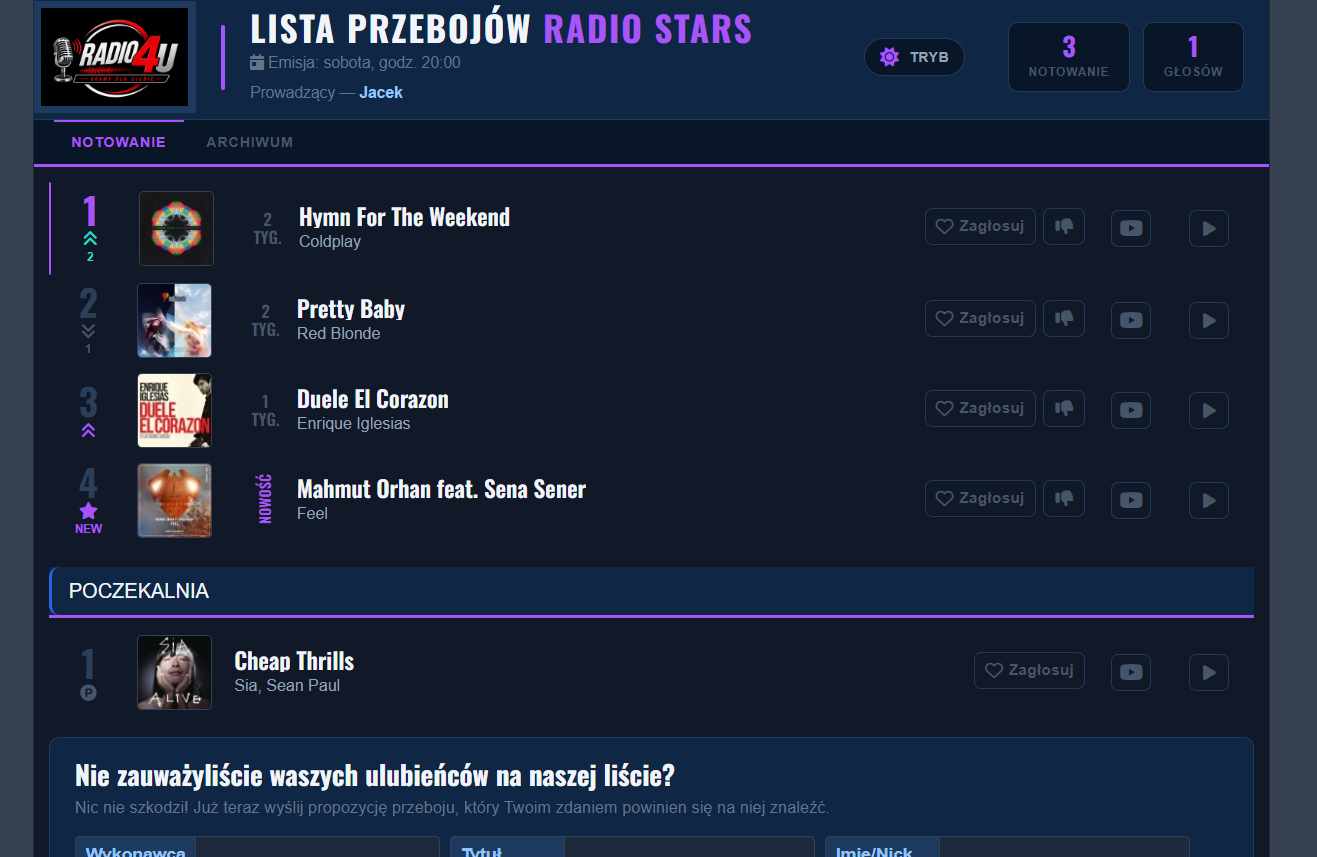
Public hit chart — night mode
Public chart — night mode, station accent, position movement and listener voting
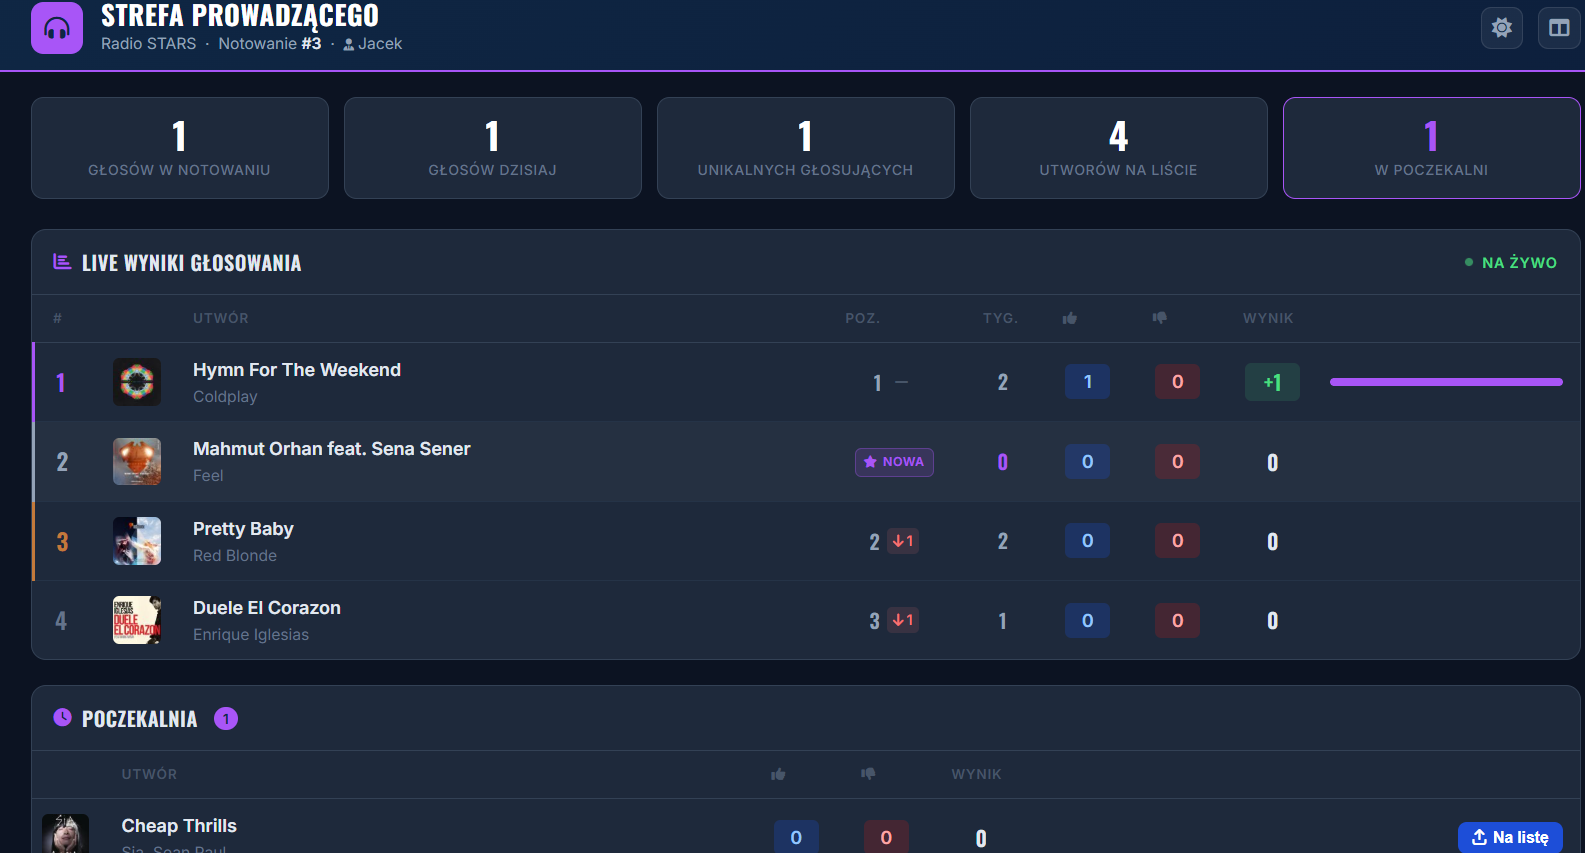
Host zone — live results
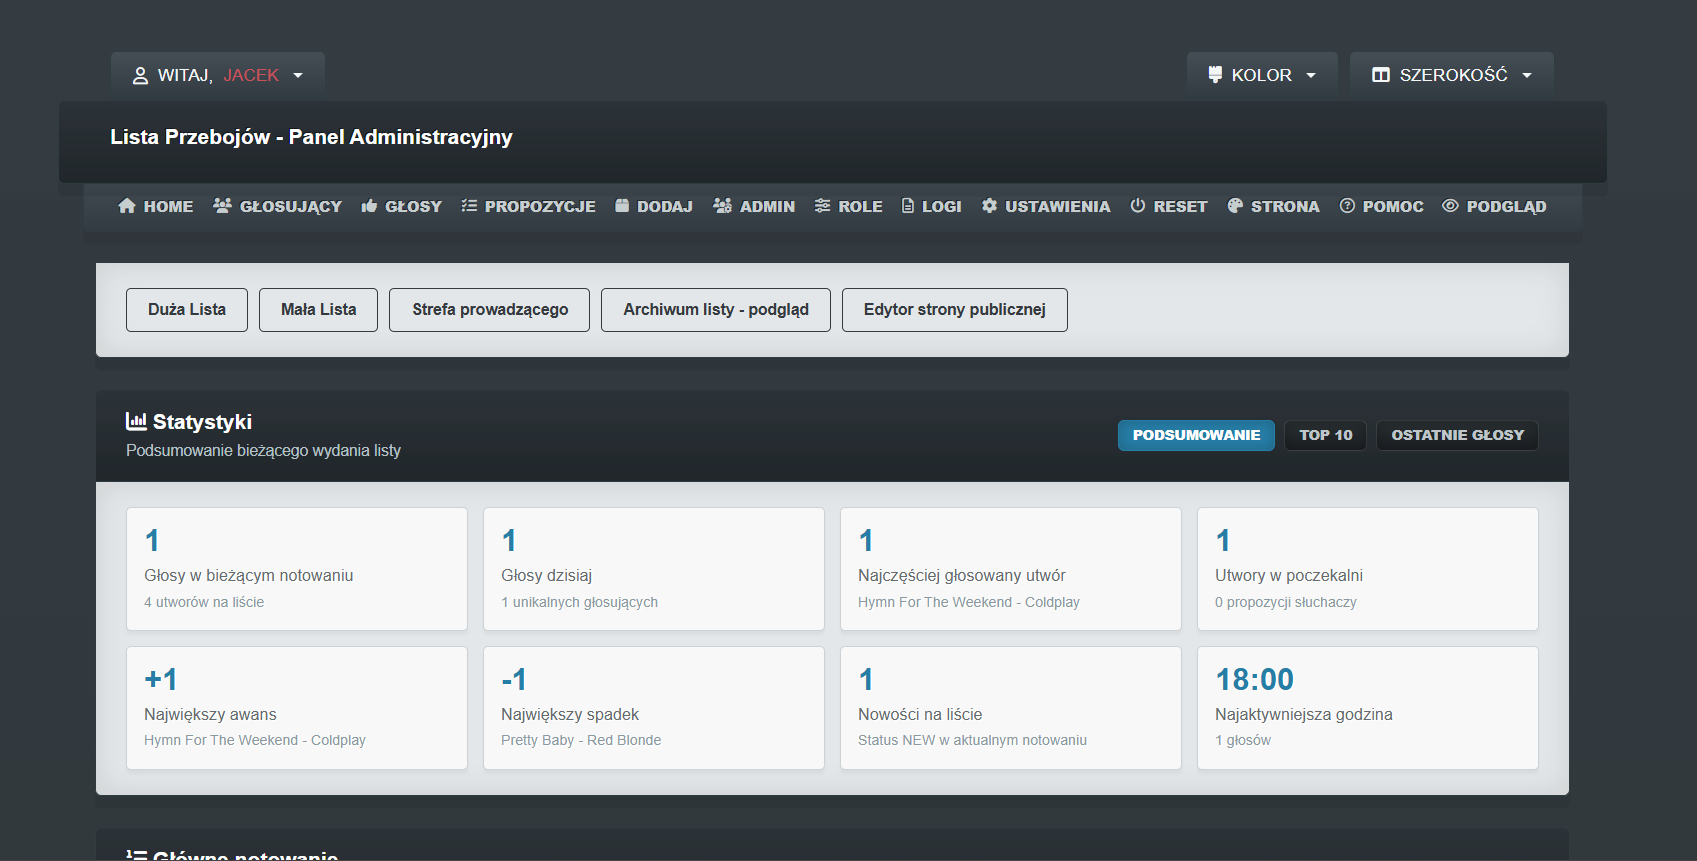
Admin panel
Admin panel — stats and control
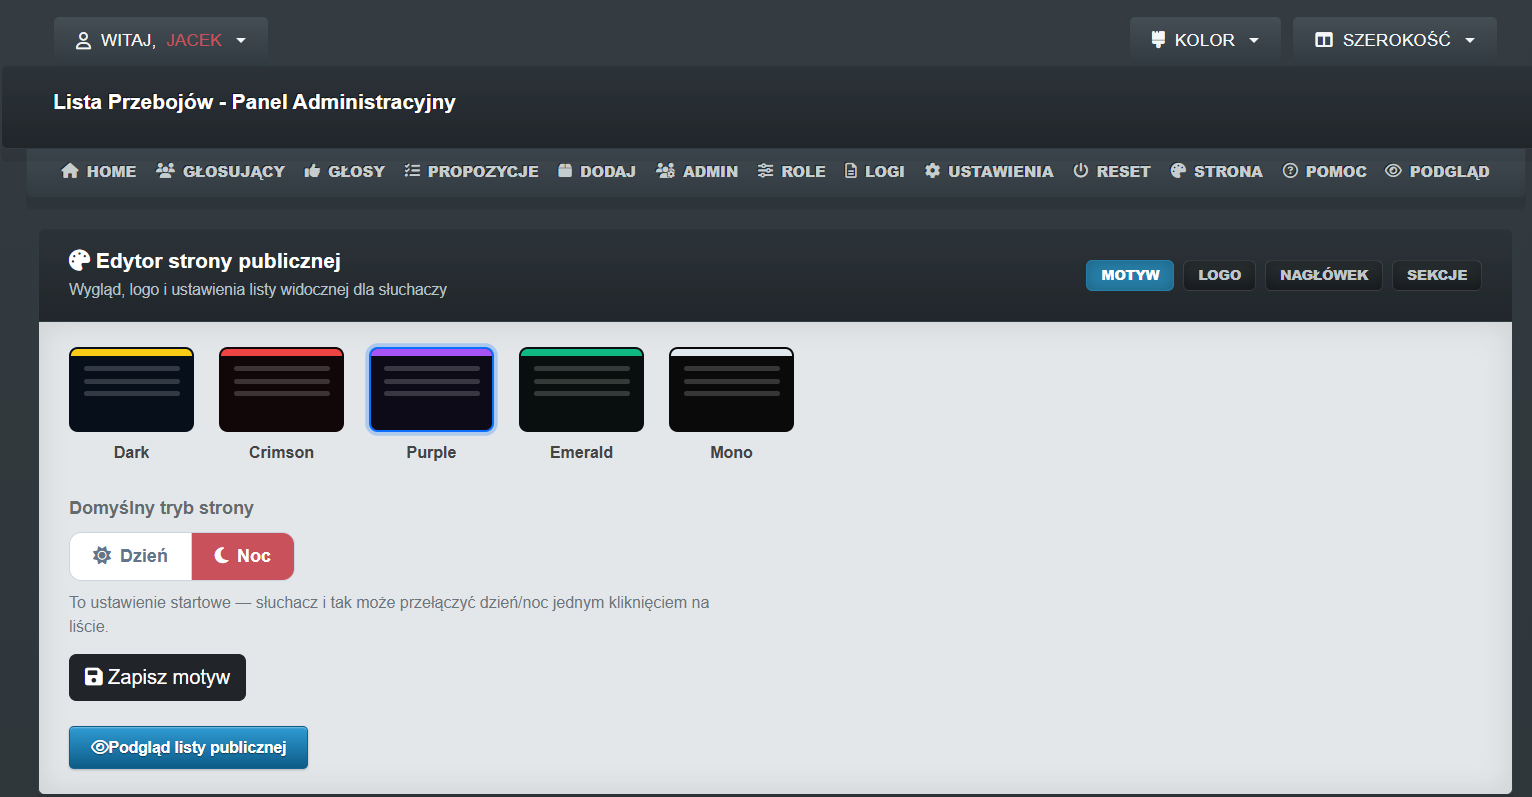
Appearance editor
Station look — colors + default day/night mode
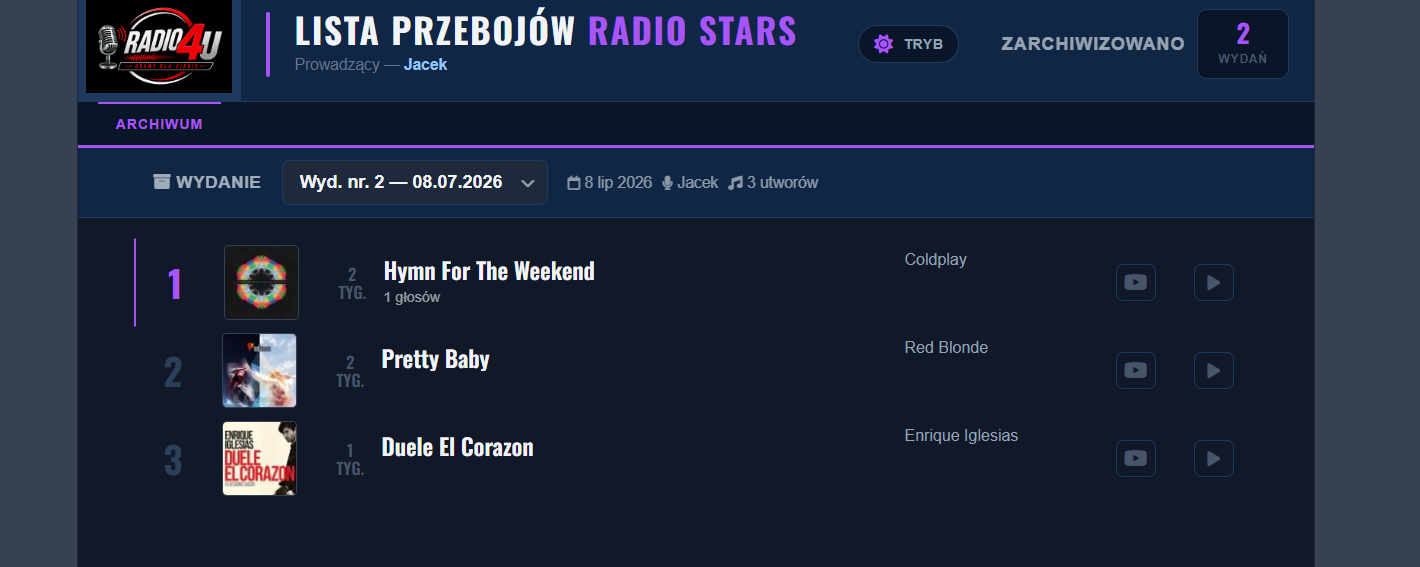
Chart archive
Archive — every past edition
Demo

Don't take our word for it.

Click and see a live chart — real countdown, voting, day/night mode.

▶ Open live demo
License

One fair price. No subscription.

Commercial license
€60
one-time — not monthly
  • One domain
  • Two installations
  • Transferable
  • Updates
  • One year of support
Get a license

After purchase you receive an installation package, a license key, and access to updates and support.

A complete system that supports real radio shows — from voting to archive.

Our story

Born on air, not on slides.

The problem existed for years. Running a countdown ate up hours of manual work — week after week, in the same spreadsheets.

The solution came from real radio practice. At a real microphone, with listener votes and an archive — battle-tested, not theoretical.

Now it's available to other stations. What started on one antenna is now a finished solution for any broadcaster. That's the idea behind CERANIMUS.

The problem existed for years

Hours of manual work on every chart.

A solution from practice

Built on air, during real broadcasts.

Now — for other stations

A ready solution for any broadcaster.

Let's talk

Looking for a solution for your station?

In radio, many decisions happen in conversation. Get in touch — we'll show you how it works for you.

✉ Contact us